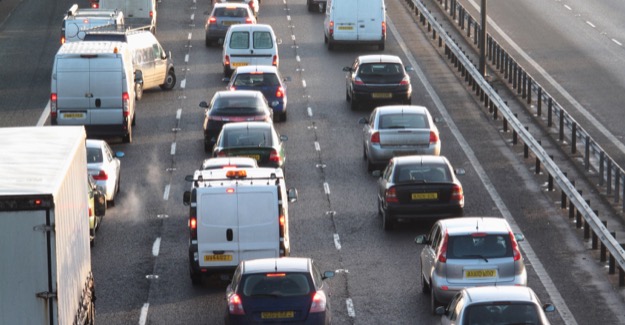
Relentless rise in car and van ownership
The number of households with four or more cars has soared by 51 per cent to nearly half a million over the past decade.
Overall, the number of households with two or more cars or vans has up nearly a fifth (18 per cent).
Of the 348 local authorities in England and Wales, East Dorset District Council has the highest number of cars and vans per head of population.
For every thousand people – men, women and children – living in the East Dorset council area there are 694 cars.
This compares with an average of 487 cars and vans per thousand people across England and Wales as a whole.
At the other end of the scale Hackney has the fewest at 170 cars and vans per thousand people.
The work also shows that Hart District Council in Hampshire has the highest proportion of households with two or more cars, followed by South Northamptonshire, Surrey Heath and Uttlesford.
The data can be viewed by individual local authority by viewing this interactive map.
The figures are revealed in analysis by the RAC Foundation of the just-released 2011 Census data and comparison with similar figures from the 2001 Census.
The table below shows the top ten local authorities in England and Wales based on car ownership:
|
Local Authority |
Number of cars per thousand people in 2011 |
% change since 2001 |
Council wealth ranking |
|
East Dorset |
694 |
9.0 |
84 |
|
South Northamptonshire |
685 |
9.6 |
57 |
|
Stratford-on-Avon |
674 |
6.6 |
46 |
|
Cotswold |
670 |
8.7 |
66 |
|
Maldon |
669 |
8.5 |
124 |
|
Hart |
667 |
3.7 |
12 |
|
South Bucks |
666 |
3.0 |
20 |
|
Malvern Hills |
664 |
10.5 |
70 |
|
East Hampshire |
664 |
8.7 |
49 |
|
Uttlesford |
663 |
4.6 |
41 |
Note: The wealth index is based on the percentage of people in higher managerial, administrative and professional occupations.
The table below shows the bottom ten local authorities in England and Wales based on car ownership:
|
Local Authority |
Number of cars per thousand people in 2011 |
% change since 2001 |
Wealth ranking |
|
Hackney |
170 |
-23.6 |
117 |
|
Tower Hamlets |
172 |
-15.6 |
52 |
|
Islington |
187 |
-21.1 |
16 |
|
Newham |
198 |
-16.4 |
319 |
|
Southwark |
210 |
-18.3 |
52 |
|
Camden |
212 |
-16.2 |
10 |
|
Lambeth |
220 |
-19.2 |
37 |
|
Westminster |
223 |
-18.2 |
5 |
|
City of London |
229 |
-14.9 |
1 |
|
Hammersmith and Fulham |
240 |
-18.8 |
12 |
The table below shows the top ten local authorities in England and Wales based on two-car households:
|
Local Authority |
% of 2+ car households in 2011 |
% change in 2+ car households since 2001 |
Wealth ranking |
|
|
Hart |
57 |
3.2 |
12 |
|
|
South Northamptonshire |
56 |
8 |
57 |
|
|
Surrey Heath |
56 |
1.3 |
24 |
|
|
Uttlesford |
54 |
6 |
41 |
|
|
Wokingham |
54 |
1.9 |
8 |
|
|
South Bucks |
54 |
1.3 |
20 |
|
|
Chiltern |
53 |
1.7 |
14 |
|
|
East Hampshire |
52 |
6 |
49 |
|
|
Harborough |
51 |
5.6 |
52 |
|
|
Daventry |
51 |
6.6 |
84 |
The table below shows the bottom ten local authorities in England and Wales based on two-car households:
|
Local Authority |
% of 2+ car households in 2011 |
% change in 2+ car households since 2001 |
Wealth ranking |
|
|
Hackney |
5 |
-31.5 |
117 |
|
|
Islington |
5 |
-29.3 |
16 |
|
|
Tower Hamlets |
5 |
-19.6 |
52 |
|
|
City of London |
6 |
4.5 |
1 |
|
|
Southwark |
7 |
-24.8 |
52 |
|
|
Westminster |
7 |
-16.5 |
5 |
|
|
Camden |
7 |
-13.9 |
10 |
|
|
Lambeth |
8 |
-26.4 |
37 |
|
|
Hammersmith and Fulham |
8 |
-26.3 |
12 |
|
|
Kensington and Chelsea |
10 |
-5.9 |
3 |
Ends
Contacts:
RAC Foundation:
Philip Gomm – Head of External Communications
[email protected] | 020 7747 3445 | 020 7389 0601 (ISDN) | 07711 776448
Notes to editors:
The RAC Foundation is a transport policy and research organisation which explores the economic, mobility, safety and environmental issues relating to roads and their users. The Foundation publishes independent and authoritative research with which it promotes informed debate and advocates policy in the interest of the responsible motorist.


