Local authorities in Scotland made a £33.6 million surplus or ‘profit’ from their parking activities in 2013/14, the last financial year for which data is available.
This is just higher than the previous year when the surplus was £33.4 million.
Data analysed by the RAC Foundation shows that between them, the 32 councils had a combined income from their parking activities – charges and penalty income from on- and off-street parking – of £73.3 million.
However the combined cost for councils of running their parking activities was £39.8 million.
Once these costs are subtracted from the income then the surplus (or deficit) is left.
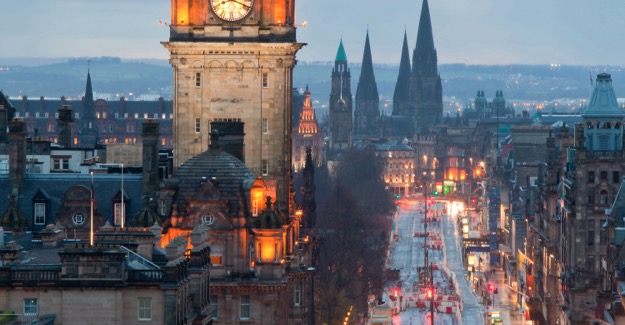
Edinburgh had the biggest surplus (£15.3 million).
It was followed by Glasgow (£10.3 million) and Aberdeen (£5 million).
Between them these three local authorities generated 91% of the total net surplus in Scotland.
Of the 32 councils studied:
- 16 showed a surplus
- 2 did not provide parking accounts
- 14 broke even or showed a deficit
The full table is in notes to editors below.
The analysis was carried out for the RAC Foundation by David Leibling. The data studied is that which is returned annually to the Scottish government by local authorities.
Parking income figures are not broken down into constituent parts so it not possible to know the total number of penalty charge notices (PCNs) issued by councils. However some authorities publish these figures in their annual parking reports. For example Edinburgh issues about 230,000 PCNs each year and Dundee 23,000. Extrapolation would suggest the total for Scotland is likely to be around 700,000 annually.
Professor Stephen Glaister, director of the RAC Foundation, said:
“These numbers tell the definitive story of who is making what from public parking in Scotland.
“Not all authorities are generating a surplus but overall we are talking about big money.
“Nobody wants a parking free for all but when we are talking about such large sums local authorities should be transparent with residents and drivers about what their parking policy is, why charges are set at the level they are and where the profits are going.”
ENDS
Contacts:
Philip Gomm – Head of External Communications – RAC Foundation
020 7747 3445 | 07711 776448 | [email protected] | 020 7389 0601 (ISDN)
Notes to editors:
The RAC Foundation is a transport policy and research organisation that explores the economic, mobility, safety and environmental issues relating to roads and their users. The Foundation publishes independent and authoritative research with which it promotes informed debate and advocates policy in the interest of the responsible motorist.
The RAC Foundation is a registered charity, number 1002705.
This is a link to David Leibling’s report:
This is the full table of Scottish local authority parking surpluses:
|
|
Surplus |
||||||
|
2010/11 |
2011/12 |
2012/13 |
2013/14 |
Change between 2013/14 and 2012/13 |
|||
|
£million |
% |
||||||
|
1 |
Edinburgh, City of |
13.09 |
14.01 |
15.18 |
15.30 |
1c |
|
|
2 |
Glasgow City |
6.99 |
6.82 |
10.86 |
10.30 |
-5a |
|
|
3 |
Aberdeen City |
4.27 |
4.32 |
4.36 |
5.01 |
15c |
|
|
4 |
Dundee City |
0.65 |
0.29 |
0.37 |
0.74 |
100c |
|
|
5 |
Perth & Kinross |
0.72 |
1.03 |
0.61 |
0.71 |
16c |
|
|
6 |
Renfrewshire |
0.84 |
0.71 |
0.57 |
0.61 |
7c |
|
|
7 |
South Lanarkshire |
0.56 |
0.58 |
0.31 |
0.46 |
48c |
|
|
8 |
Fife |
0.63 |
0.55 |
0.85 |
0.34 |
-60a |
|
|
9 |
Highland |
0.25 |
0.32 |
0.24 |
0.29 |
21c |
|
|
10 |
Argyll & Bute |
0.46 |
0.43 |
0.40 |
0.28 |
-30a |
|
|
11 |
South Ayrshire |
0.12 |
0.05 |
0.17 |
0.25 |
47c |
|
|
12 |
Aberdeenshire |
0.20 |
0.28 |
0.27 |
0.24 |
-11a |
|
|
13 |
East Ayrshire |
0.47 |
0.38 |
0.31 |
0.23 |
-26a |
|
|
14 |
Moray |
0.17 |
0.36 |
0.26 |
0.22 |
-15a |
|
|
15 |
Stirling |
0.12 |
-0.02 |
-0.08 |
0.15 |
-288b |
|
|
16 |
Falkirk |
0.14 |
0.13 |
0.08 |
0.14 |
75c |
|
|
17 |
East Lothian |
~ |
~ |
~ |
~ |
|
|
|
18 |
North Lanarkshire |
~ |
~ |
~ |
~ |
|
|
|
19 |
Shetland Islands |
0 |
-0.01 |
-0.01 |
0.00 |
-100b |
|
|
20 |
Orkney Islands |
0.00 |
0.01 |
0.01 |
-0.03 |
-400a |
|
|
21 |
Eilean Siar (Hebrides) |
-0.01 |
0.01 |
0.02 |
-0.05 |
-350a |
|
|
22 |
Midlothian |
-0.09 |
-0.09 |
-0.08 |
-0.06 |
-25b |
|
|
23 |
East Renfrewshire |
-0.05 |
-0.04 |
-0.12 |
-0.07 |
-42b |
|
|
24 |
West Dunbartonshire |
-0.08 |
-0.08 |
-0.08 |
-0.08 |
0 |
|
|
25 |
Clackmannanshire |
0.01 |
-0.05 |
-0.09 |
-0.09 |
0 |
|
|
26 |
Inverclyde |
0 |
0 |
0 |
-0.13 |
|
|
|
27 |
West Lothian |
-0.04 |
-0.10 |
-0.10 |
-0.14 |
40d |
|
|
28 |
Angus |
-0.11 |
-0.15 |
-0.13 |
-0.16 |
23d |
|
|
29 |
North Ayrshire |
-0.07 |
-0.25 |
-0.26 |
-0.19 |
-27b |
|
|
30 |
Scottish Borders |
-0.26 |
-0.11 |
-0.13 |
-0.21 |
62d |
|
|
31 |
Dumfries & Galloway |
-0.26 |
-0.26 |
-0.27 |
-0.22 |
-19b |
|
|
32 |
East Dunbartonshire |
-0.07 |
-0.06 |
-0.11 |
-0.28 |
155d |
|
|
|
Total |
28.63 |
29.04 |
33.39 |
33.56 |
1c |
|
|
~ No parking accounts |
|||||||
|
a Decreasing surplus |
|||||||
|
b Decreasing deficit |
|||||||
|
c Increasing surplus |
|||||||
|
d Increasing deficit |
|||||||


