Average reduction of 36% in death and serious injury collisions
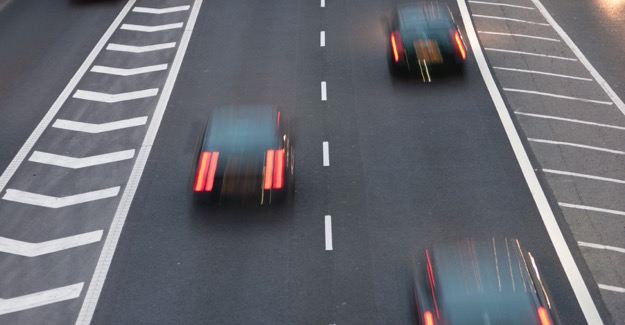
The use of average speed cameras has been found, on average, to cut the number of crashes resulting in death or serious injury by more than a third.
Research for the RAC Foundation by Road Safety Analysis found that on average – having allowed for natural variation and overall trends – the number of fatal and serious collisions decreases by 36% after average speed cameras are introduced.
The average reduction in personal injury collisions of all severities was found to be 16%.*
By the end of 2015 there were at least 50 stretches of road in Great Britain permanently covered by average speed cameras keeping a total length of 255 miles (410 km) under observation.
The 50 stretches range in length from under half a mile in Nottingham to 99 miles (159 km) on the A9 between Dunblane and Inverness in Scotland.
Many of these stretches of road will be monitored by several sets of cameras.
The first stretch of road to become permanently managed by average speed cameras was on the A6514 Ring Road in Nottingham back in 2000. At least 12 systems were installed last year alone.
A full list of those stretches of road in Great Britain with average speed cameras covered by this study follows at the end of this press release.
One reason for the increase in usage has been the reduction in the installation costs of permanent average speed cameras. The cost of permanent average speed cameras is now typically around £100,000 per mile, compared with around £1.5m per mile in the early 2000s.
Some of the older spot speed cameras – commonly known as Gatso cameras – have been around for 25 years and still use 35mm film. As they come to the end of their operating lives they are starting to be replaced, in some cases with average speed camera systems.
In August this year, for example, West Midlands Police turned on average speed camera systems on eight stretches of roads in Birmingham and Solihull. This was three years after the old-style, wet-film, Gatso cameras were turned off.
Steve Gooding, director of the RAC Foundation, said:
“All the indications are that compliance with average speed cameras is high; now this research reveals the sizeable impact they can have in reducing death and serious injuries.
“As the cost of technology continues to fall, more and more authorities are considering whether to install average speed cameras and so it will be important to ensure that casualty and compliance data is openly available so we can continue to assess and understand the road safety benefits they deliver.”
Richard Owen, operations director at Road Safety Analysis, said:
“Measuring the influence of speed cameras in isolation from other road safety improvements over time has previously never been undertaken on this scale.
“The statistical results clearly show good collision reductions on the stretches of road where average speed cameras are used; often covering much longer distances than other enforcement systems.
“The findings and methodology used should be of significant interest to those considering the use of this technology, as well as those wishing to evaluate their own road safety schemes.”
Contact:
Philip Gomm – Head of External Communications – RAC Foundation
[email protected] | 020 7747 3445 | 07711 776448 | 020 7389 0601 (ISDN)
Steve Gooding – Director – RAC Foundation
[email protected] | 07912 177450 | 020 7747 3445
Notes to editors:
The RAC Foundation is a transport policy and research organisation that explores the economic, mobility, safety and environmental issues relating to roads and their users.
The Foundation publishes independent and authoritative research with which it promotes informed debate and advocates policy in the interest of the responsible motorist. All the Foundation’s work is available at: www.racfoundation.org
The full report is available to download under embargo:
*Talking specifically about the collision reduction assessment, the report says:
“The standout result from the analysis shows, after accounting for SSPs [site-selection periods] and trend, a 36.4% (95% confidence interval: 25-46%) reduction in the mean rate of fatal and serious collisions in the post-installation period. The change in personal injury collisions of all severities was less pronounced, with a 16% (95% confidence interval: 9-22%) reduction. Both results were classified as highly statistically significant according to the analysis, meaning that they almost certainly did not arise by chance or through random variation.”
Average speed cameras are also often used on a temporary basis to manage traffic through roadworks but these have not been included in this study. Nor was the single stretch of road managed by average speed cameras in Northern Ireland.
The table below gives the full list of average speed camera sites in Great Britain as obtained for the RAC Foundation by Road Safety Analysis as of the middle of 2015. The quoted site lengths reflect the extent of the enforcement infrastructure, not the total length of the road itself. There were cameras installed on the A46 at Cotgrave in January 2006 but these were later removed. There might be other sites where average speed cameras are permanently installed but have not been revealed to the researchers. Although not part of this study there is a 6.25-mile stretch of the A2 between Bangor and Holywood in Northern Ireland that is monitored by average speed cameras.
|
SiteID |
Site Name |
Site Length |
Installation Date |
|
|
|
|
(miles) |
(km) |
|
|
NO1 |
A6514 Ring Road, Nottingham |
3.96 |
6.37 |
Aug-00 |
|
NO2 |
A610 Bobbers Mill, Nottingham |
1.12 |
1.80 |
Sep-00 |
|
SY2 |
A616 Stocksbridge, South Yorkshire HA |
6.79 |
10.93 |
Dec-02 |
|
LO4 |
Tower Bridge, City of London |
0.42 |
0.68 |
Sep-03 |
|
NO3 |
A46 Fosse Road, Nottinghamshire HA |
0.9 |
1.45 |
Dec-04 |
|
NO4 |
A631 Gringley on the Hill, Nottinghamshire |
1.98 |
3.19 |
Jan-05 |
|
NO5 |
A631 Scaftworth, Nottinghamshire |
1.48 |
2.38 |
Mar-05 |
|
SC1 |
A77 Ayr to Stranraer, Transport Scotland |
17.81 |
28.66 |
Jul-05 |
|
NO7 |
A52 Bingham, Nottinghamshire HA |
2.39 |
3.85 |
Jan-06 |
|
NO8 |
A52 Radcliffe Road, Nottinghamshire |
2.01 |
3.23 |
Jan-06 |
|
NO9 |
A52 Saxondale, Nottinghamshire |
0.65 |
1.05 |
Jan-06 |
|
CA1 |
A14 Huntingdon to Girton, Cambridgeshire HA |
7.13 |
11.47 |
Mar-07 |
|
ME1 |
A228 Isle of Grain, Kent |
4.54 |
7.31 |
Nov-07 |
|
NO10 |
B6004 Oxclose Lane, Nottinghamshire |
0.62 |
1.00 |
Apr-08 |
|
ES1 |
A127 Arterial Road, Essex |
5.31 |
8.55 |
Jan-09 |
|
ES2 |
A130 Canvey Way, Essex |
2.47 |
3.98 |
Apr-09 |
|
LO3 |
Rotherhithe Tunnel, London |
1.24 |
2.00 |
Jun-09 |
|
LO1 |
Blackwall Tunnel, London |
1.54 |
2.48 |
Jul-09 |
|
NO11 |
A611 Annesley, Nottinghamshire |
0.66 |
1.06 |
Nov-09 |
|
NO12 |
A631 Beckingham Bypass, Nottinghamshire |
0.64 |
1.03 |
Nov-09 |
|
LI2 |
A52 Ropsley, Lincolnshire |
5.42 |
8.72 |
Dec-09 |
|
CU1 |
A66 Bass Lake, Cumbria |
1.74 |
2.80 |
Jan-10 |
|
CH1 |
A537 Cat and Fiddle, Cheshire |
9.66 |
15.55 |
Apr-10 |
|
ST1 |
A38 Shenstone to Bassetts Pole, Staffordshire |
3.34 |
5.38 |
Jun-10 |
|
CA2 |
B1096 Ramsey Forty Foot, Cambridgeshire |
3.9 |
6.28 |
Jul-10 |
|
NO13 |
A60 London Road, Nottingham |
0.24 |
0.39 |
Sep-10 |
|
NO14 |
A60 Mansfield Road, Nottingham |
0.66 |
1.06 |
Sep-10 |
|
CA3 |
A14 Girton to Fen Ditton, Cambridgeshire HA |
4.27 |
6.87 |
Mar-11 |
|
NO15 |
A614 Old Rufford Road, Nottinghamshire |
11.86 |
19.09 |
Jan-12 |
|
ES3 |
Marine Parade, Southend, Essex |
0.45 |
0.72 |
Mar-12 |
|
WA1 |
A465 Head of the Valleys, Wales |
7.91 |
12.73 |
May-12 |
|
SY1 |
A61 Sheffield to A616 (T) South Yorkshire HA |
4.14 |
6.66 |
Nov-12 |
|
NO16 |
A6097 Epperstone Bypass, Nottingham |
6.44 |
10.36 |
Apr-13 |
|
HU1 |
A16 Peaks Parkway |
1.19 |
1.92 |
Jul-13 |
|
NO17 |
A6097 (A614 East Bridgford), Nottingham |
1.91 |
3.07 |
Feb-14 |
|
NO18 |
A60 Chuckney Hill, Nottinghamshire |
1.25 |
2.01 |
Mar-14 |
|
SC2 |
A9 Dunblane to Inverness, Transport Scotland |
98.55 |
158.60 |
Oct-14 |
|
WA2 |
M4 J40-41a Port Talbot HA |
2.09 |
3.36 |
Oct-14 |
|
ES4 |
A120 Pelhams Corner, Essex |
1.83 |
2.95 |
Feb-15 |
|
ES5 |
A13 Aveley to Thurrock |
3.51 |
5.65 |
Feb-15 |
|
NO19 |
A38 Alfreton Road to Sherwood, Nottinghamshire |
2.58 |
4.15 |
Feb-15 |
|
ES6 |
A12 Kelvedon Bypass, Essex |
4.47 |
7.19 |
Mar-15 |
|
NO20 |
Bells Lane, Nottingham |
0.41 |
0.66 |
May-15 |
|
NO21 |
Winchester Street, Nottingham |
0.37 |
0.60 |
May-15 |
|
LI1 |
A15 Metheringham, Lincs |
2.54 |
4.09 |
Jun-15 |
|
LO2 |
Dartford Free-Flow |
3.58 |
5.76 |
Jun-15 |
|
ST2 |
A515 Duffield Lane, Staffordshire |
3.42 |
5.50 |
Jun-15 |
|
ST3 |
A519 Woodseaves, Staffordshire |
0.68 |
1.09 |
Jun-15 |
|
CA4 |
A1139 Fletton Parkway, Cambridgeshire |
0.96 |
1.54 |
Jul-15 |
|
NO22 |
South Church Drive, Nottingham |
1.52 |
2.45 |
Nov-15 |
|
|
TOTAL |
254.56 |
409.66 |
|