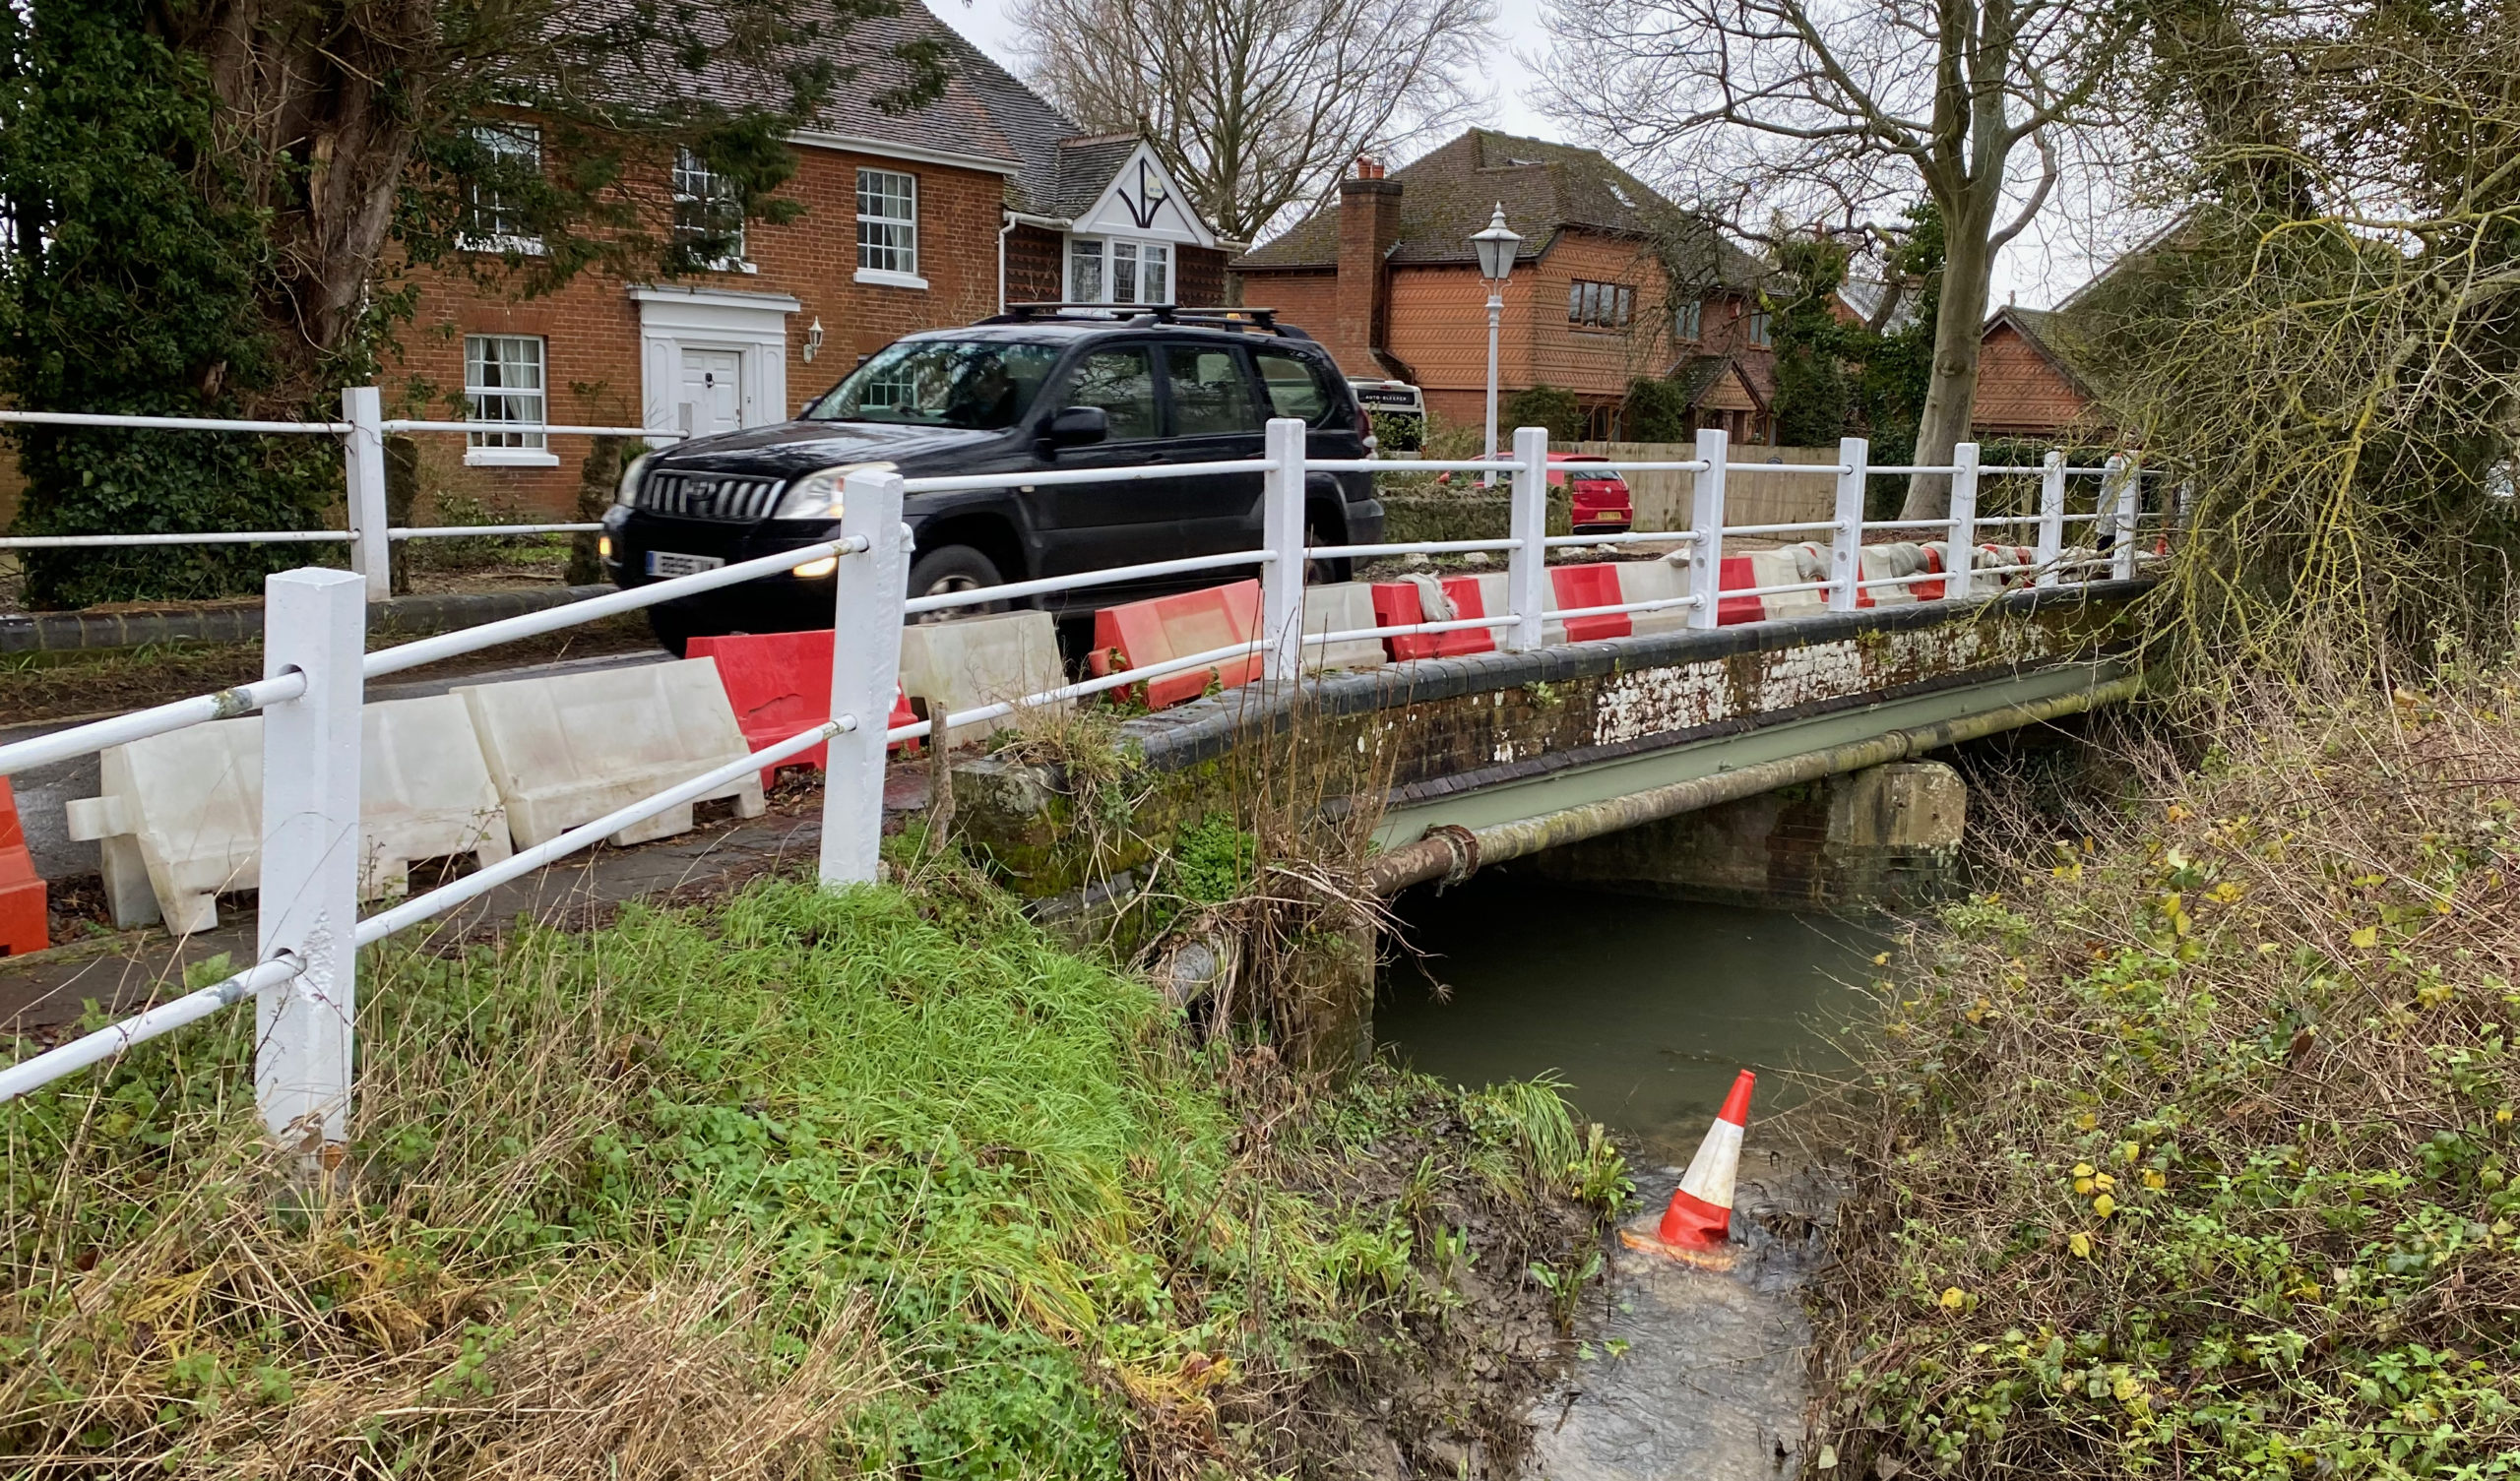
The number of substandard road bridges managed by councils across Great Britain has risen for the second year running.
At the same time council engineering experts are warning about a shortage of staff to carry out inspections to ensure the bridge stock remains safe and fit for use.
Local authorities in England, Scotland and Wales identified 3,211 bridges – defined by highway engineers as structures over 1.5m in span – as being substandard at the end of 2021.
(NB: the term ‘bridge’ in highway engineering encompasses major structures spanning estuaries through to stretches of road at least 1.5 metres in length such as might span a culvert carrying water under the carriageway.)
This is up 3.4% on the 3,105 figure twelve months previously, and up 5% on the 3,055 figure a year before that.
However, it is below the 3,194 total for 2018 and the 3,441 figure for 2017.
A substandard bridge means one unable to carry the heaviest vehicles now seen on our roads, including lorries of up to 44 tonnes. Many of the substandard bridges are subject to weight restrictions. Others will be under programmes of increased monitoring or even managed decline.
The analysis was carried out by the RAC Foundation which submitted FOI requests to 206 local highways authorities in November 2021.
The analysis is based on data provided by 196 councils (four fewer than the previous year) out of the 206 asked.
Between them the 196 councils are responsible for maintaining 70,944 bridges meaning 4.5% of the inventory disclosed is substandard.
Councils say they would ideally want to bring 2,374 (74%) of the 3,105 substandard bridges back up to full carrying capacity.
However, budget limitations mean they anticipate that only 379 of these will have the necessary work carried out on them within the next five years.
The estimated cost to bring all the substandard bridges back up to perfect condition is £1.16 billion (up slightly on the £992 million figure of a year earlier).
The study reveals that the one-time cost to clear the full maintenance backlog on all 70,944 bridges would be £5.44 billion.
The survey of local highways authorities was carried out by the RAC Foundation with the help of the National Bridges Group of ADEPT (the Association of Directors of Environment, Economics, Planning and Transportation).
The ten councils in Britain with the highest number of substandard bridges are:
| Local Authority | Number of bridges | Number of substandard bridges | Proportion of substandard bridges |
| Devon | 2,714 | 229 | 8% |
| Oxfordshire | 785 | 222 | 28% |
| Essex | 981 | 167 | 17% |
| Somerset | 1,499 | 128 | 9% |
| Cornwall | 1,009 | 124 | 12% |
| Suffolk | 1,447 | 120 | 8% |
| Northumberland | 978 | 99 | 10% |
| Gloucestershire | 822 | 91 | 11% |
| Lancashire | 1,476 | 78 | 5% |
| Aberdeenshire | 1,346 | 77 | 6% |
The ten councils in Britain with the highest proportion of substandard bridges are:
| Local Authority | Number of bridges | Number of substandard bridges | Proportion of substandard bridges |
| Hammersmith and Fulham | 4 | 2 | 50% |
| Hartlepool | 35 | 16 | 46% |
| Kingston upon Thames | 11 | 4 | 36% |
| Waltham Forest | 50 | 17 | 34% |
| Oxfordshire | 785 | 222 | 28% |
| Kensington and Chelsea | 4 | 1 | 25% |
| Brent | 40 | 9 | 23% |
| Conwy | 292 | 57 | 20% |
| Thurrock | 49 | 9 | 18% |
| Wolverhampton | 58 | 10 | 17% |
The RAC Foundation also asked the national roads authorities about their bridges:
| Number of bridges | Number of substandard bridges | Proportion of substandard bridges | |
| Highways England | 9,399 | 77 | 1% |
| Transport Scotland | 2,612 | 39 | 1% |
| Welsh Assembly | 1,268 | 104 | 8% |


