
But river damage assessments falling
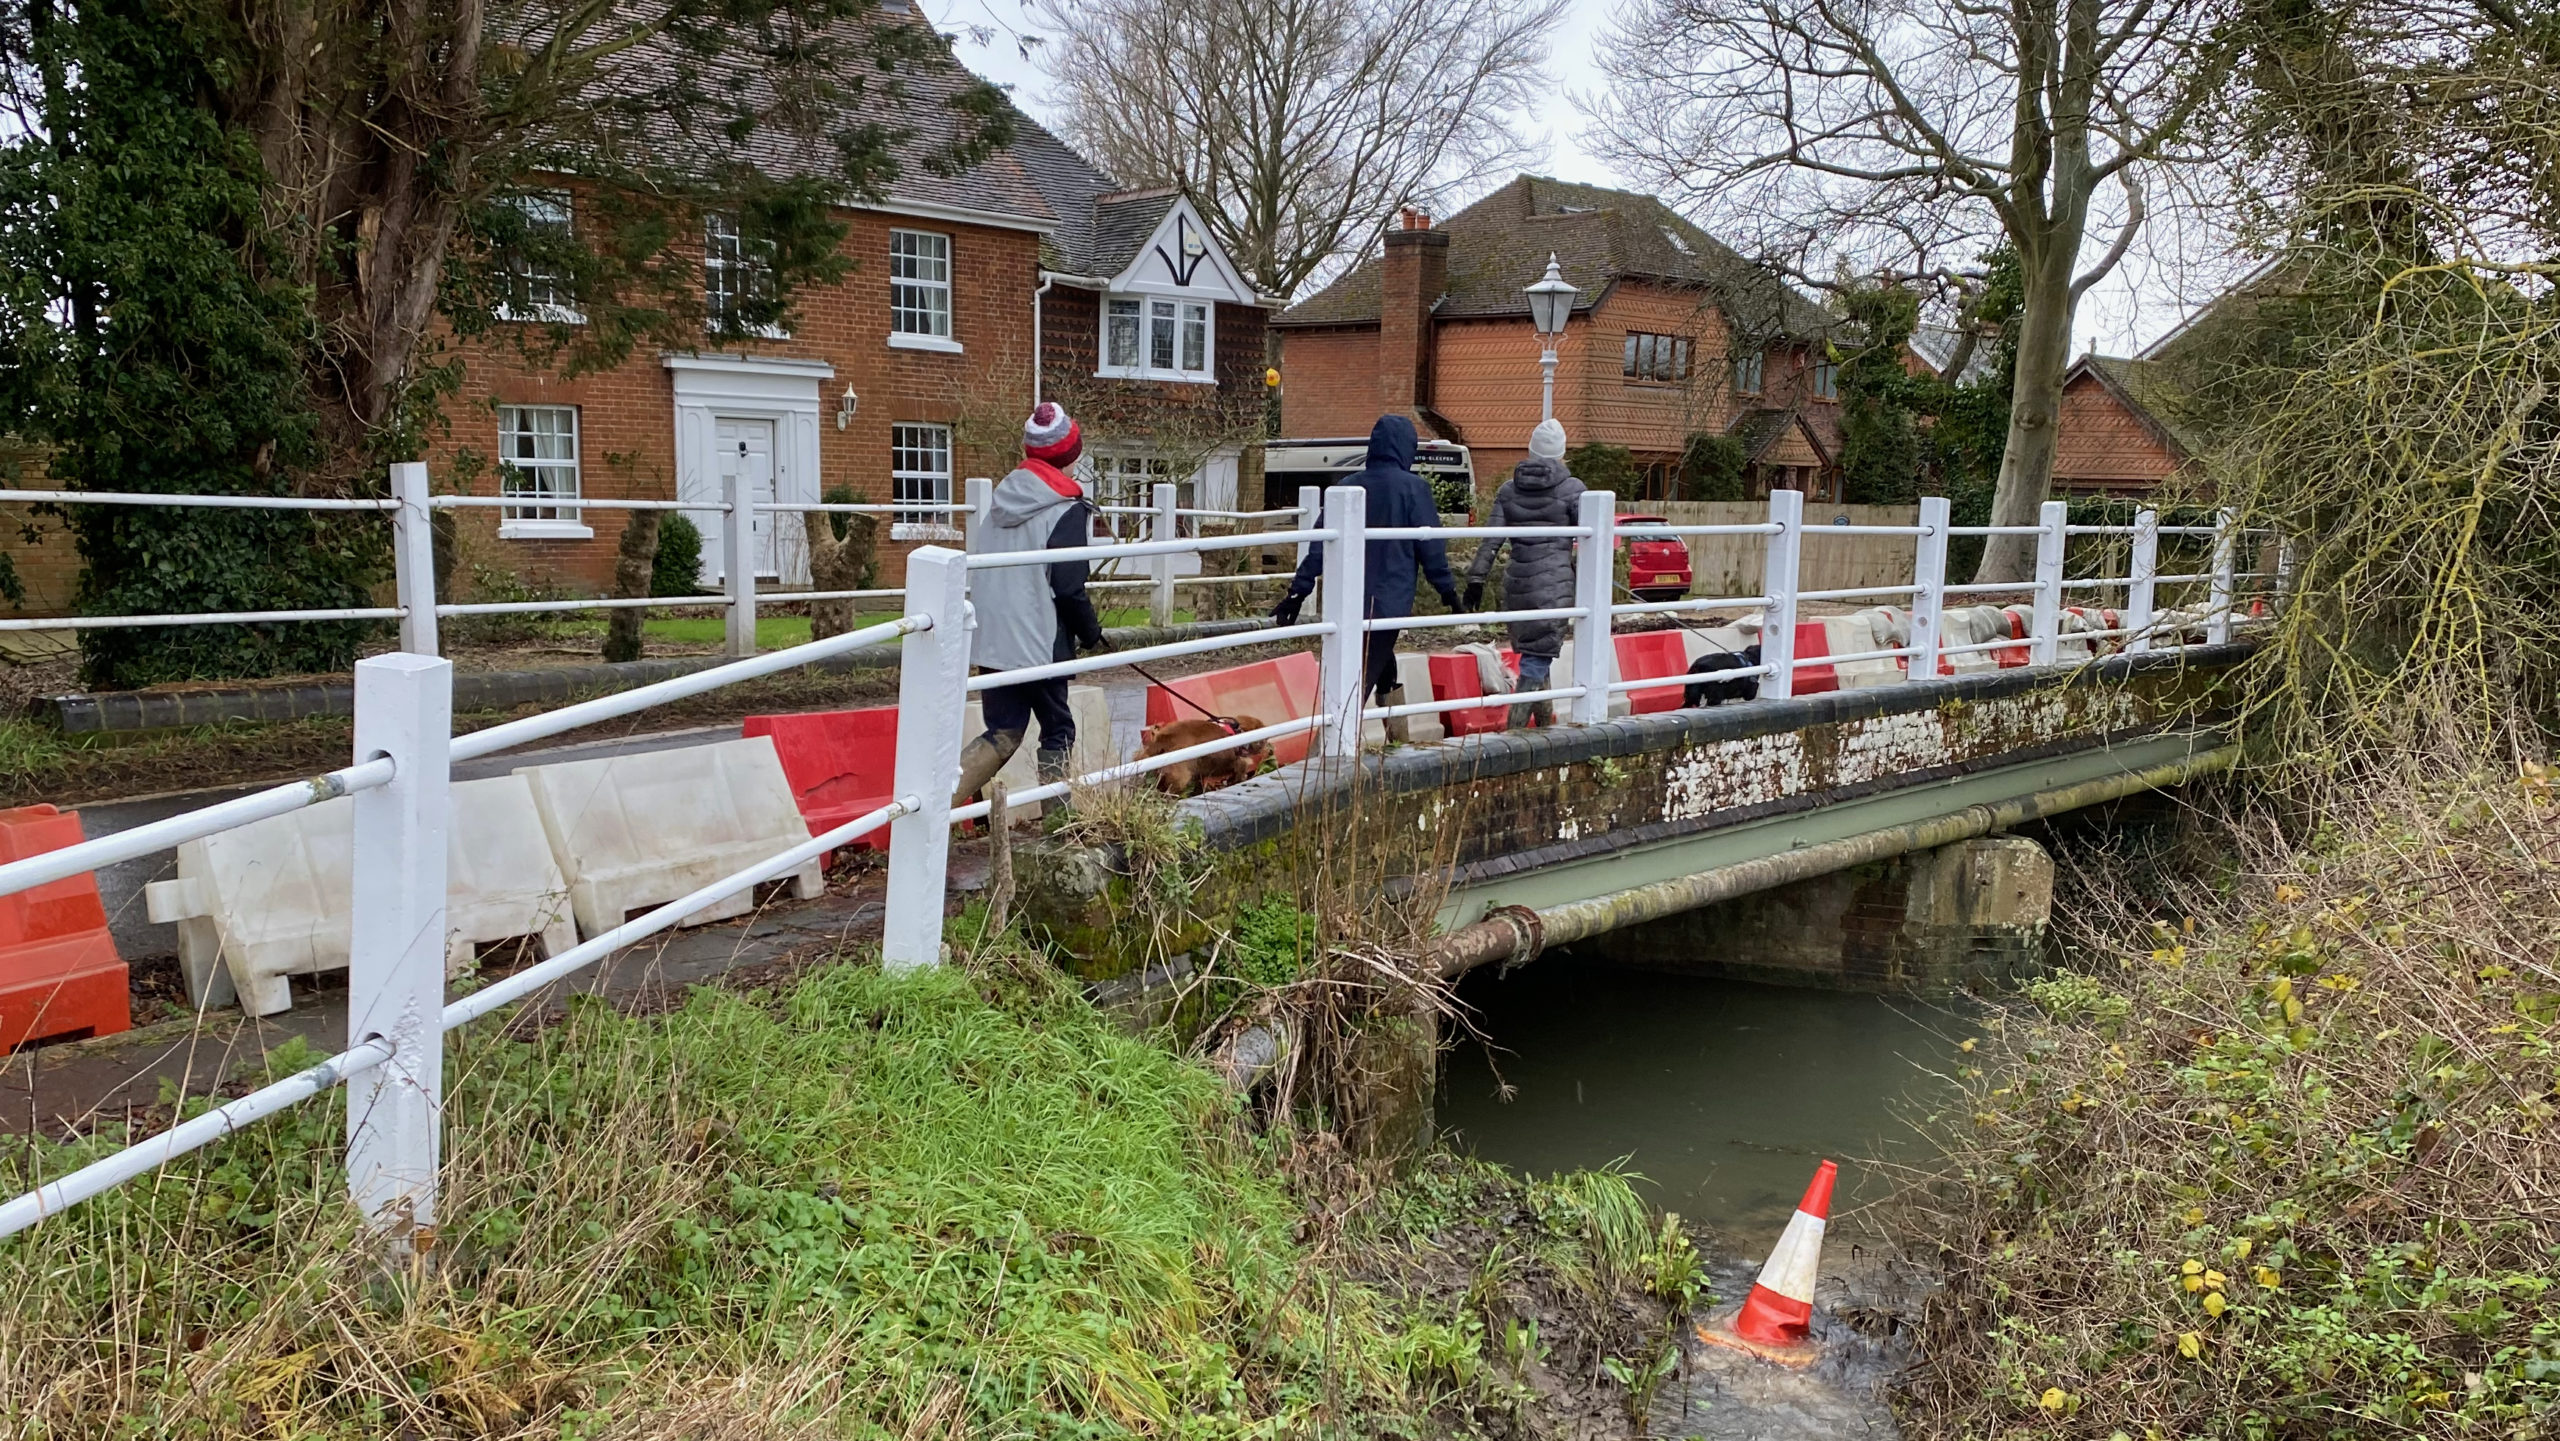
The number of substandard road bridges managed by councils across Great Britain is increasing.
Local authorities in England, Scotland and Wales have identified 3,105 bridges – defined as structures over 1.5m in span – as being substandard.
This was 1.6% up on the 3,055 figure twelve months before.
Substandard means unable to carry the heaviest vehicles now seen on our roads, including lorries of up to 44 tonnes. Many of the substandard bridges are subject to weight restrictions. Others will be under programmes of increased monitoring or even managed decline.
The analysis was carried out by the RAC Foundation and is based on responses to FOI requests made by the Foundation in October 2020 to 206 local highways authorities.
The analysis is based on data provided by 199 councils out of the 206 asked.
Between them the councils are responsible for maintaining 71,656 bridges meaning 4.3% of the inventory is substandard.
Councils also reported that, at the time they responded in Autumn 2020, ten bridges across Great Britain had fully collapsed in the previous 12 months. A further 30 had partially collapsed.
Of the 10 full collapses, 7 were in Aberdeenshire. Caerphilly, Derbyshire and Dumfries & Galloway had 1 each.
The 30 partial collapses were in: Powys (6); Conwy (5); Denbighshire (3); Dumfries & Galloway (2); North Yorkshire (2); Perth and Kinross (2); and Barnet, Buckinghamshire, Fife, Gwynedd, Lincolnshire, Merton, Neath Port Talbot, Peterborough, Somerset and Stirling (one each).
Despite these failures the analysis shows an apparent large decline in the number of bridges being assessed for damage caused by river flow.
| 2019-20 | 2018-19 | |
| Number of BD97 Stage 1 scour assessments | 2687 | 3936 |
| – based on (authorities) | 31 | 37 |
| – based on (bridges) | 20618 | 22771 |
| % of bridges that received Stage 1 scour assessments | 13% | 17% |
| Number of BD97 Stage 2 scour assessments | 79 | 235 |
| – based on (authorities) | 13 | 11 |
| – based on (bridges) | 9243 | 9429 |
| % of bridges that received Stage 2 scour assessments | 0.9% | 2.5% |
Typically, a bridge which has its foundations in a watercourse should receive an initial Stage 1 scour assessment which can lead to a Stage 2 scour assessment if any faults or concerns are uncovered.
Between them, councils say they would ideally want to bring 2,256 (73%) of the 3,105 substandard bridges back up to full carrying capacity.
However, budget restrictions mean they anticipate that only 392 of these will have the necessary work carried out on them within the next five years.
The estimated cost to bring all the substandard bridges back up to perfect condition is £985 million (down slightly on the £1.1 billion figure of a year earlier).
The study reveals that the one-time cost to clear the maintenance backlog on all 71,656 bridges is £5.54 billion, down fractionally from the previous year’s figure of £5.55 billion.
The survey of local highways authorities was carried out by the RAC Foundation with the help of the National Bridges Group of ADEPT (the Association of Directors of Environment, Economics, Planning and Transportation).
The ten councils in Britain with the highest number of substandard bridges are:
| Local Authority | Number of bridges | Number of substandard bridges | Proportion of substandard bridges |
| Devon | 2716 | 233 | 9% |
| Essex | 961 | 165 | 17% |
| Somerset | 1497 | 153 | 10% |
| Cornwall | 1009 | 139 | 14% |
| Suffolk | 1449 | 120 | 8% |
| Oxfordshire | 783 | 119 | 15% |
| Northumberland | 978 | 101 | 10% |
| Lancashire | 1473 | 75 | 5% |
| Cumbria | 1892 | 69 | 4% |
| Gloucestershire | 938 | 60 | 6% |
The ten councils in Britain with the highest proportion of substandard bridges are:
| Local Authority | Number of bridges | Number of substandard bridges | Proportion of substandard bridges |
| Hammersmith and Fulham | 4 | 2 | 50% |
| Liverpool | 38 | 15 | 39% |
| Kingston upon Thames | 11 | 4 | 36% |
| Brent | 43 | 15 | 35% |
| Southend-on-Sea | 64 | 22 | 34% |
| Barking and Dagenham | 58 | 18 | 31% |
| Southampton | 22 | 6 | 27% |
| Kensington and Chelsea | 4 | 1 | 25% |
| Conwy | 293 | 58 | 20% |
| Wolverhampton | 58 | 10 | 17% |
A full list of councils is available at the end of this press release, together with top ten tables for England, Scotland and Wales.
In the January 2021 floods caused by Storm Christoph washed away Llanerch Bridge in North Wales which had been built in the 1800s.
Disruption continues in London after restrictions were imposed on the 133-year-old Hammersmith Bridge over the Thames in London, first in April 2019 when it was closed to motorised vehicles, and then in August 2020 when it was also closed to pedestrians, cyclists and river traffic after microcracks were found in the cast iron pedestals at each end of the bridge that support the suspension structure. The work required to reopen the bridge to vehicles is estimated to cost £141 million.
Another example of the chaos caused when a bridge fails was the congestion that arose following the closure of part of the A52 Clifton Bridge over the River Trent in Nottingham in February 2020 after corrosion was found to have affected steel reinforcing rods. Repairs to the bridge – managed by Highways England – include adding external strengthening measures and will not be complete until the end of 2021.
Whilst no local authority manages structures directly technically comparable with the Morandi Bridge that collapsed in Genoa in August 2018, between them they do have a number of so-called post-tensioned (PT) bridges with hidden cables.
These PT bridges require intrusive inspections (Post-Tensioned Special Inspections or PTSIs) that can cost £100,000 each.
The number of local-authority managed PT bridges and how many require inspections:
| Local Authorities that have PT bridges | Total number of PT bridges | Bridges that have had PTSIs in the last 18 years | Bridges that require but have not had PTSIs in last 18 years | Estimate of funding required for the additional PTSIs |
| 105 | 675 | 297 | 293 | £22.4m |
The RAC Foundation also asked national roads authorities about their bridges:
| Number of bridges | Number of substandard bridges | Proportion of substandard bridges | |
| Highways England | 9,392 | 95 | 1% |
| Transport Scotland | 2,615 | 33 | 1% |
| Welsh Assembly | 1,269 | 103 | 8% |
Steve Gooding, director of the RAC Foundation, said:
“We might not yet be at the stage where London Bridge has fallen down, as described in the nursery rhyme, but several other bridges across the country have suffered partial or total collapses.
“At the same time there has been a worrying decline in the number of inspections carried out to examine just how much damage rivers, and the debris they carry, are doing to bridges below the waterline. This is storing up trouble for the future as our weather gets more extreme and traffic volumes rise again after the Covid-19 restrictions.”
Kevin Dentith, chair of the ADEPT National Bridges Group, said:
‘’The serious flooding we have just experienced across England means bridges with foundations in watercourses will have again been subjected to scouring. Bridge owners should satisfy themselves that appropriate action is in place to ensure the more susceptible bridges are protected.
“Whilst the number of substandard bridges may appear worrying there is often a good reason why a bridge falls into this category; it does not mean the bridge is unsafe as it will be managed by the Local Authority usually by a weight limit. A restriction such as this may be wholly appropriate for the class of road and/or location, however the survey shows Local Authorities would want to remove 2256 bridges out of this sub-standard category which can only be achieved by more investment through Government funding.
‘’As someone who has been promoting scour assessments at national conferences, webinars and advising Highway England with the BD97/12 update it is worrying that whilst the industry knows scour is the main cause of bridge collapse the survey shows the number of scour assessments has dropped so significantly where it should be increasing. Assuming survey returns are accurate there could be several reasons why this has happened including Covid-19 preventing some inspections taking place or engineers may be waiting for the new Highways England Guidance in the revised Design Manual for Road & Bridges which replaces BD97/12, due out in Spring 2021. Whatever the reason this trend needs to be reversed if we are to be sure the safety of our assets is maintained. I would like to take this opportunity to remind highway bridge owners that scour assessments can, and should, be funded through the LTP capital programme and not the under-pressure revenue budgets.”
ENDS
Contact:
Philip Gomm – Head of External Communications – RAC Foundation
[email protected] | 07711 776448 | 020 7747 3445 | 020 7389 0601 (ISDN)
Notes to editors:
The RAC Foundation is a transport policy and research organisation that explores the economic, mobility, safety and environmental issues relating to roads and their users.
The Foundation publishes independent and authoritative research with which it promotes informed debate and advocates policy in the interest of the responsible motorist. All the Foundation’s work is available at: www.racfoundation.org
GB DATA
This is a link to the table giving substandard bridge data for all councils in Great Britain:
https://www.racfoundation.org/wp-content/uploads/RAC_Foundation_Bridge_Maintenance_GB_2020.pdf
ENGLISH DATA
This is a link to the table giving substandard bridge data for councils in England only:
https://www.racfoundation.org/wp-content/uploads/RAC_Foundation_Bridge_Maintenance_England_2020.pdf
The ten councils in England with the highest number of substandard bridges are:
| Local Authority | Number of bridges | Number of substandard bridges | Proportion of substandard bridges |
| Devon | 2716 | 233 | 9% |
| Essex | 961 | 165 | 17% |
| Somerset | 1497 | 153 | 10% |
| Cornwall | 1009 | 139 | 14% |
| Suffolk | 1449 | 120 | 8% |
| Oxfordshire | 783 | 119 | 15% |
| Northumberland | 978 | 101 | 10% |
| Lancashire | 1473 | 75 | 5% |
| Cumbria | 1892 | 69 | 4% |
| Gloucestershire | 938 | 60 | 6% |
The ten councils in England with the highest proportion of substandard bridges are:
| Local Authority | Number of bridges | Number of substandard bridges | Proportion of substandard bridges |
| Hammersmith and Fulham | 4 | 2 | 50% |
| Liverpool | 38 | 15 | 39% |
| Kingston upon Thames | 11 | 4 | 36% |
| Brent | 43 | 15 | 35% |
| Southend-on-Sea | 64 | 22 | 34% |
| Barking and Dagenham | 58 | 18 | 31% |
| Southampton | 22 | 6 | 27% |
| Kensington and Chelsea | 4 | 1 | 25% |
| Wolverhampton | 58 | 10 | 17% |
| Essex | 961 | 165 | 17% |
SCOTTISH DATA
This is a link to the table giving substandard bridge data for councils in Scotland only:
https://www.racfoundation.org/wp-content/uploads/RAC_Foundation_Bridge_Maintenance_Scotland_2020.pdf
The ten councils in Scotland with the highest number of substandard bridges are:
| Local Authority | Number of bridges | Number of substandard bridges | Proportion of substandard bridges |
| Perth and Kinross | 847 | 50 | 6% |
| Aberdeenshire | 1346 | 48 | 4% |
| Fife | 397 | 48 | 12% |
| East Ayrshire | 381 | 39 | 10% |
| Highland | 2007 | 39 | 2% |
| Scottish Borders | 1195 | 28 | 2% |
| Argyll & Bute | 901 | 27 | 3% |
| South Lanarkshire | 775 | 23 | 3% |
| Stirling | 291 | 13 | 4% |
| Dumfries & Galloway | 740 | 10 | 1% |
The ten councils in Scotland with the highest proportion of substandard bridges are:
| Local Authority | Number of bridges | Number of substandard bridges | Proportion of substandard bridges |
| Dundee City | 25 | 4 | 16% |
| Fife | 397 | 48 | 12% |
| East Ayrshire | 381 | 39 | 10% |
| Perth and Kinross | 847 | 50 | 6% |
| Glasgow City | 182 | 9 | 5% |
| Stirling | 291 | 13 | 4% |
| East Renfrewshire | 130 | 5 | 4% |
| Falkirk | 224 | 8 | 4% |
| Aberdeenshire | 1346 | 48 | 4% |
| Argyll & Bute | 901 | 27 | 3% |
WELSH DATA
This is a link to the table giving substandard bridge data for councils in Wales only:
https://www.racfoundation.org/wp-content/uploads/RAC_Foundation_Bridge_Maintenance_Wales_2020.pdf
The ten councils in Wales with the highest number of substandard bridges are:
| Local Authority | Number of bridges | Number of substandard bridges | Proportion of substandard bridges |
| Conwy | 293 | 58 | 20% |
| Carmarthenshire | 799 | 54 | 7% |
| Powys | 1399 | 47 | 3% |
| Denbighshire | 282 | 23 | 8% |
| Monmouthshire | 400 | 22 | 6% |
| Gwynedd | 631 | 18 | 3% |
| Swansea | 157 | 12 | 8% |
| Cardiff | 113 | 11 | 10% |
| Rhondda | 307 | 10 | 3% |
| Bridgend | 175 | 9 | 5% |
The ten councils in Wales with the highest proportion of substandard bridges are:
| Local Authority | Number of bridges | Number of substandard bridges | Proportion of substandard bridges |
| Conwy | 293 | 58 | 20% |
| Merthyr Tydfil | 37 | 5 | 14% |
| Cardiff | 113 | 11 | 10% |
| Denbighshire | 282 | 23 | 8% |
| Swansea | 157 | 12 | 8% |
| Caerphilly | 117 | 8 | 7% |
| Carmarthenshire | 799 | 54 | 7% |
| Monmouthshire | 400 | 22 | 6% |
| Bridgend | 175 | 9 | 5% |
| Torfaen | 189 | 9 | 5% |