But road infrastructure at risk from recent flooding
The number of substandard road bridges managed by councils across Great Britain has fallen slightly over the past year.
Local authorities in England, Scotland and Wales have identified 3,061 bridges – defined as structures over 1.5 m in span – as being substandard.
This was 4.2% down on the 3,194 figure twelve months earlier.
Substandard means unable to carry the heaviest vehicles now seen on our roads, including lorries of up to 44 tonnes.
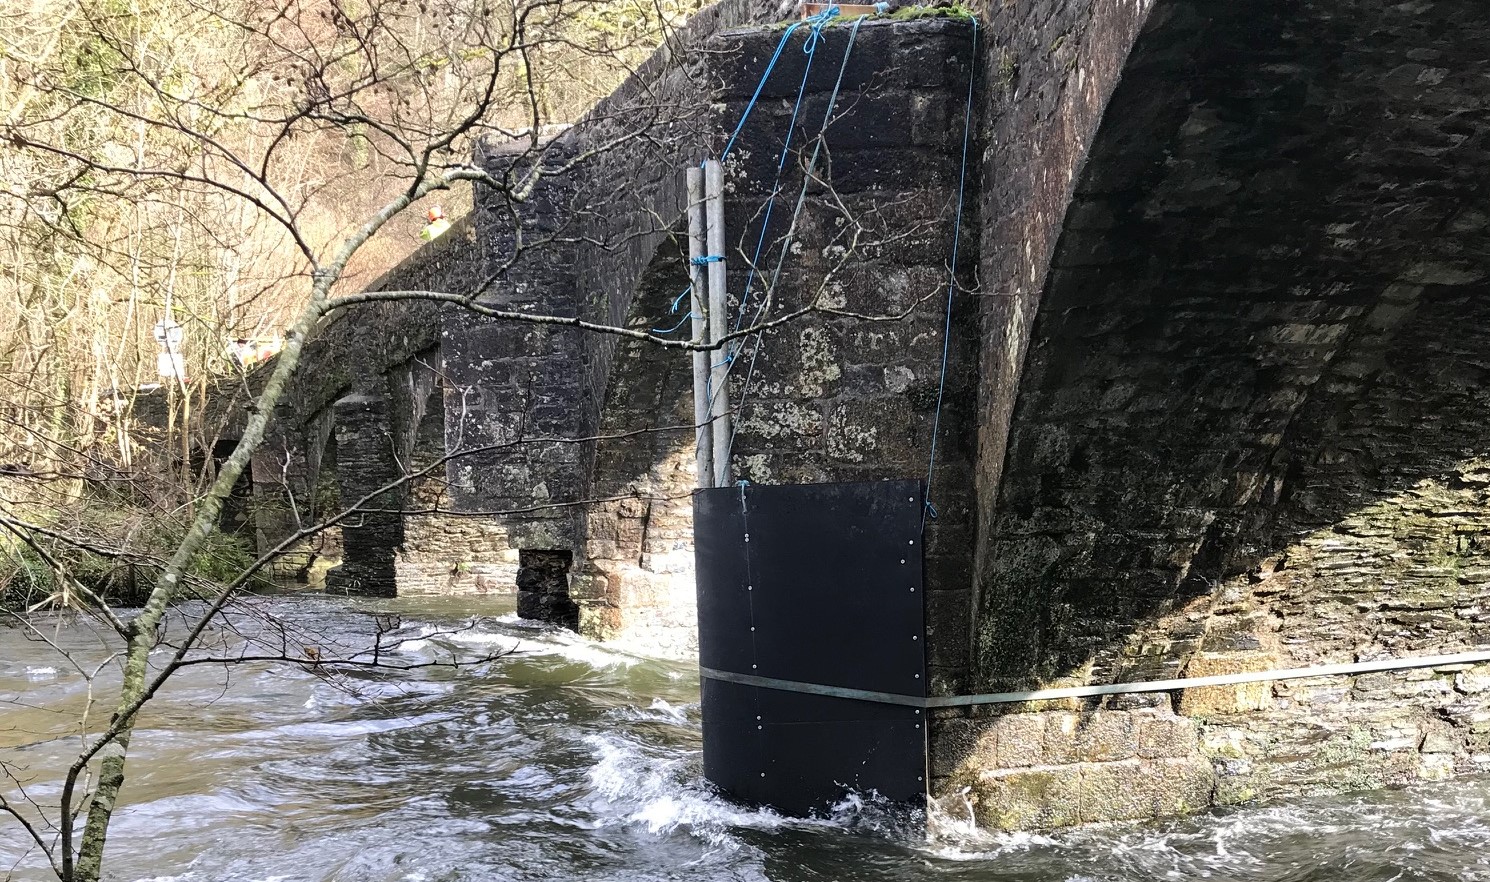
However, the progress is under risk of reversal because of the pounding bridges have been taking from the recent flooding and the debris carried along by the current.
Many of the existing substandard bridges are subject to weight restrictions. Others will be under programmes of increased monitoring or even managed decline.
The analysis was carried out by the RAC Foundation and is based on FOI responses from 203 of the 210 local highways authorities in Britain.
The 3,061 substandard bridges make up 4.3% of the total of 71,505 bridges the 203 councils manage between them.
The estimated cost to bring all the substandard bridges back up to perfect condition is £1.12 billion (down fractionally on the £1.17 billion figure of a year earlier).
The study reveals that the one-time cost to clear the maintenance backlog on all 71,505 bridges is £5.55 billion, down from the previous year’s figure of £6.5 billion.
Between them, councils say they would ideally want to bring 2,084 (68%) of the 3,061 substandard bridges back up to full carrying capacity.
However, budget restrictions mean they anticipate that only 359 of these will have the necessary work carried out on them within the next five years.
The survey of local highways authorities was carried out by the RAC Foundation with the help of the National Bridges Group of ADEPT (the Association of Directors of Environment, Economics, Planning and Transportation).
The ten councils in Britain with the highest number of substandard bridges are:
| Local Authority | Number of bridges | Number of substandard bridges | Proportion of substandard bridges |
| Devon | 2717 | 241 | 9% |
| Essex | 915 | 163 | 18% |
| Somerset | 1507 | 153 | 10% |
| Cornwall | 1009 | 140 | 14% |
| Suffolk | 1298 | 126 | 10% |
| Northumberland | 979 | 102 | 10% |
| Lancashire | 1473 | 76 | 5% |
| Aberdeenshire | 1311 | 66 | 5% |
| Cumbria | 1901 | 66 | 3% |
| Conwy | 286 | 61 | 21% |
The ten councils in Britain with the highest proportion of substandard bridges are:
| Local Authority | Number of bridges | Number of substandard bridges | Proportion of substandard bridges |
| Islington | 12 | 8 | 67% |
| Hammersmith and Fulham | 4 | 2 | 50% |
| Bristol | 140 | 52 | 37% |
| Kingston upon Hull | 77 | 28 | 36% |
| Brent | 40 | 14 | 35% |
| Southend-on-Sea | 64 | 22 | 34% |
| Kingston upon Thames | 11 | 3 | 27% |
| Southampton | 22 | 6 | 27% |
| Kensington and Chelsea | 4 | 1 | 25% |
| Lambeth | 16 | 4 | 25% |
Note: The table above was updated after initial publcation to remove Blackpool from the list. Clarification from the council meant the number of substandard bridges was revised downwards and this also brought down the proportion of substandard bridges the council has.
A full list of councils is available at the end of this press release, together with top ten tables for England, Scotland and Wales.
An example of the chaos caused when a bridge fails is the congestion caused by the ongoing closure of part of the A52 Clifton Bridge over the River Trent in Nottingham which is managed by Highways England which says repairs to corroded steel are likely to continue until the end of this year.
Whilst no local authority manages structures directly technically comparable with the Morandi Bridge that collapsed in Genoa in August 2018, they do have a number of so-called post-tensioned (PT) bridges with hidden cables.
These PT bridges require intrusive inspections (Post-Tensioned Special Inspections or PTSIs) that can cost £100,000 each.
The number of PT bridges that are local-authority managed and how many require inspections:
| Local Authorities that have PT bridges | Total number of PT bridges | Bridges that have had PTSIs in the last 18 years | Bridges that require but have not had PTSIs in last 18 years | Estimate of funding required for the additional PTSIs |
| 105 | 620 | 299 | 218 | £19.5m
|
The RAC Foundation also asked national roads authorities about their bridges:
| Number of bridges | Number of substandard bridges | Proportion of substandard bridges | |
| Highways England | 11,112 | 84 | 1% |
| Transport Scotland | 2,589 | 29 | 1% |
| Welsh Assembly | 1,252 | 78 | 6% |
Steve Gooding, director of the RAC Foundation, said:
“The condition of the bridges that carry our roads is a canary-in-a-coal-mine indicator for the health of the highway network as a whole. While our survey shows a marginal year-on-year improvement, it still reveals that while the number of structures highway authorities expect to bring up to standard in the next five years is in the hundreds, the number they’d like to restore to manage traffic demand is in the thousands.
“The recent closure of a key bridge in Nottingham shows just how bad the traffic impact can be when a structure on a key distributor route is found wanting. And as recent storms have demonstrated our road infrastructure – including bridges – is under attack not just from the ever-growing volume of traffic but from the elements.
“Highway authorities desperately need the money and the engineering expertise to monitor and ensure our highways – our most valuable publicly owned asset – are properly maintained and kept open for business.”
Kevin Dentith, chair of the ADEPT National Bridges Group, said:
‘’I am again grateful for the hard work the RAC Foundation do each year collating this information as it provides an up to date picture of the state of highway bridges in the UK. I am equally grateful for the responsible attitude shown by the UK’s bridge owners who take time out to provide the very detailed data.
“The number of sub-standard bridges shown may cause some concern but what this means is bridge owners are aware of the structures that cannot carry certain weight vehicles and they will be ensuring the public remain safe by managing the assets either by applying a weight restriction, if that is appropriate, or by on-site monitoring.
“Alongside the misery recent rain and flooding has brought to householders and businesses many highway authority bridge owners will be fearful of what they find when the waters recede. The vast volumes of water – and the debris they carry with them – will have pummelled our road bridges, some of which are already in a fragile state. With every sign suggesting that these extreme weather events will become more common it is inevitable that more money will be needed to keep our bridge stock open for traffic, and hence our towns and cities open for business.
“This year’s survey has also helped to identify the number of post tensioned bridges that need inspecting; these are often large structures with hidden components that require specialised inspection techniques which can be prohibitively expensive for some local authorities. I am hopeful that ADEPT’s previous discussions with colleagues at the Department for Transport could see additional capital funds allocated for this crucial work.’’
ENDS
Contact:
Philip Gomm – Head of External Communications – RAC Foundation
[email protected] | 020 7747 3445 | 07711 776448 | 020 7389 0601 (ISDN)
Notes to editors:
The RAC Foundation is a transport policy and research organisation that explores the economic, mobility, safety and environmental issues relating to roads and their users.
The Foundation publishes independent and authoritative research with which it promotes informed debate and advocates policy in the interest of the responsible motorist. All the Foundation’s work is available at: www.racfoundation.org
GB DATA
This is a link to the table giving substandard bridge data for all councils in Great Britain:
https://www.racfoundation.org/wp-content/uploads/RAC_Foundation_Bridge_Maintenance_GB_18-19.pdf
ENGLISH DATA
This is a link to the table giving substandard bridge data for councils in England only:
https://www.racfoundation.org/wp-content/uploads/RAC_Foundation_Bridge_Maintenance_England_18-19.pdf
The ten councils in England with the highest number of substandard bridges are:
| Local Authority | Number of bridges | Number of substandard bridges | Proportion of substandard bridges |
| Devon | 2717 | 241 | 9% |
| Essex | 915 | 163 | 18% |
| Somerset | 1507 | 153 | 10% |
| Cornwall | 1009 | 140 | 14% |
| Suffolk | 1298 | 126 | 10% |
| Northumberland | 979 | 102 | 10% |
| Lancashire | 1473 | 76 | 5% |
| Cumbria | 1901 | 66 | 3% |
| Gloucestershire | 872 | 59 | 7% |
| Hertfordshire | 1055 | 58 | 5% |
The ten councils in England with the highest proportion of substandard bridges are:
| Local Authority | Number of bridges | Number of substandard bridges | Proportion of substandard bridges |
| Islington | 12 | 8 | 67% |
| Hammersmith and Fulham | 4 | 2 | 50% |
| Bristol | 140 | 52 | 37% |
| Kingston upon Hull | 77 | 28 | 36% |
| Brent | 40 | 14 | 35% |
| Southend-on-Sea | 64 | 22 | 34% |
| Kingston upon Thames | 11 | 3 | 27% |
| Southampton | 22 | 6 | 27% |
| Kensington and Chelsea | 4 | 1 | 25% |
| Lambeth | 16 | 4 | 25% |
SCOTTISH DATA
This is a link to the table giving substandard bridge data for councils in Scotland only:
The ten councils in Scotland with the highest number of substandard bridges are:
| Local Authority | Number of bridges | Number of substandard bridges | Proportion of substandard bridges |
| Aberdeenshire | 1311 | 66 | 5% |
| Perth and Kinross | 846 | 50 | 6% |
| Fife | 397 | 48 | 12% |
| Highland | 2007 | 42 | 2% |
| East Ayrshire | 381 | 39 | 10% |
| Argyll & Bute | 901 | 28 | 3% |
| Scottish Borders | 1201 | 26 | 2% |
| South Lanarkshire | 776 | 23 | 3% |
| Stirling | 432 | 12 | 3% |
| Dumfries & Galloway | 740 | 10 | 1% |
The ten councils in Scotland with the highest proportion of substandard bridges are:
| Local Authority | Number of bridges | Number of substandard bridges | Proportion of substandard bridges |
| Fife | 397 | 48 | 12% |
| Dundee City | 25 | 3 | 12% |
| East Ayrshire | 381 | 39 | 10% |
| Perth and Kinross | 846 | 50 | 6% |
| Aberdeenshire | 1311 | 66 | 5% |
| Glasgow City | 182 | 9 | 5% |
| Falkirk | 224 | 9 | 4% |
| East Renfrewshire | 130 | 5 | 4% |
| Argyll & Bute | 901 | 28 | 3% |
| South Lanarkshire | 776 | 23 | 3% |
WELSH DATA
This is a link to the table giving substandard bridge data for councils in Wales only:
https://www.racfoundation.org/wp-content/uploads/RAC_Foundation_Bridge_Maintenance_Wales_18-19.pdf
The ten councils in Wales with the highest number of substandard bridges are:
| Local Authority | Number of bridges | Number of substandard bridges | Proportion of substandard bridges |
| Conwy | 286 | 61 | 21% |
| Carmarthenshire | 799 | 56 | 7% |
| Powys | 1399 | 48 | 3% |
| Denbighshire | 161 | 25 | 16% |
| Monmouthshire | 400 | 22 | 6% |
| Gwynedd | 631 | 18 | 3% |
| Swansea | 158 | 12 | 8% |
| Cardiff | 113 | 11 | 10% |
| Rhondda | 205 | 11 | 5% |
| Bridgend | 175 | 9 | 5% |
The ten councils in Wales with the highest proportion of substandard bridges are:
| Local Authority | Number of bridges | Number of substandard bridges | Proportion of substandard bridges |
| Conwy | 286 | 61 | 21% |
| Denbighshire | 161 | 25 | 16% |
| Merthyr Tydfil | 37 | 4 | 11% |
| Cardiff | 113 | 11 | 10% |
| Swansea | 158 | 12 | 8% |
| Carmarthenshire | 799 | 56 | 7% |
| Caerphilly | 117 | 8 | 7% |
| Monmouthshire | 400 | 22 | 6% |
| Newport | 74 | 4 | 5% |
| Rhondda | 205 | 11 | 5% |